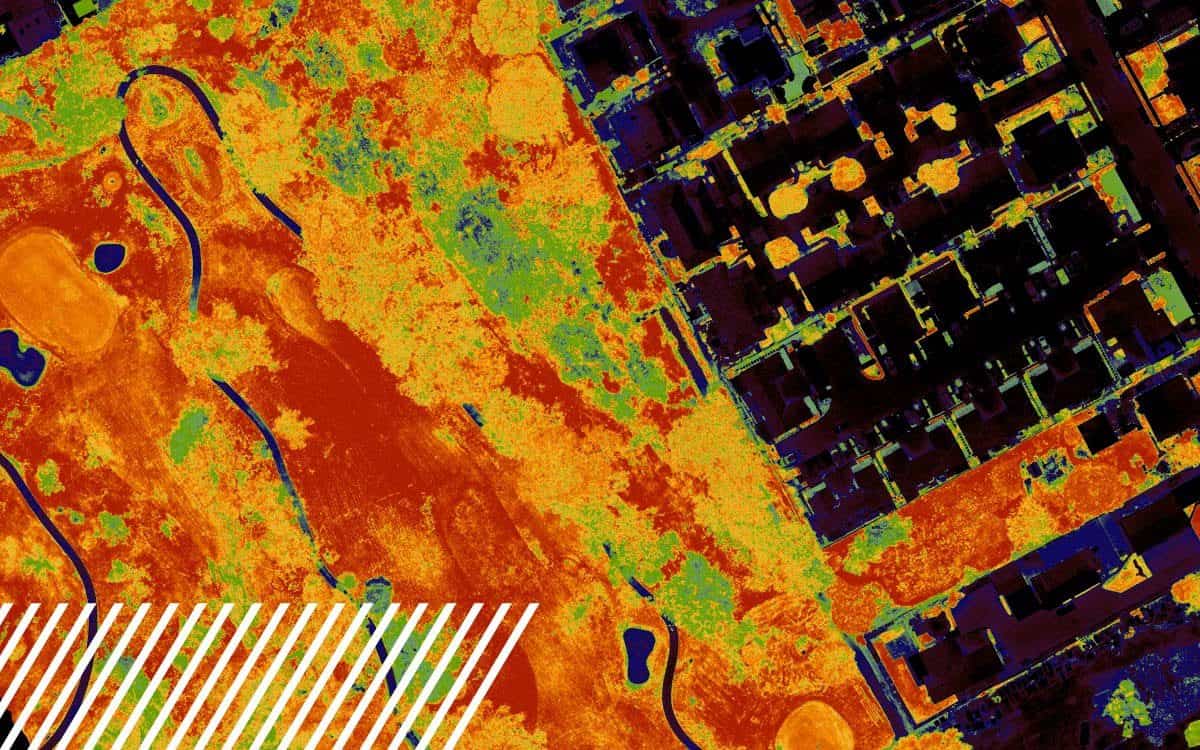
Understanding NDVI: Normalized Difference Vegetation Index
The Normalized Difference Vegetation Index (NDVI) is a crucial metric derived from multispectral imaging and is particularly useful in assessing vegetation health. NDVI measures the difference between near-infrared (which vegetation strongly reflects) and red light (which vegetation absorbs). This index provides a simple numerical indicator that can range from -1 to +1, where higher values indicate healthier, more vigorous vegetation.
How NDVI Works
NDVI is calculated using the formula: NDVI=(NIR−Red)(NIR+Red)text{NDVI} = frac{(NIR – Red)}{(NIR + Red)}NDVI=(NIR+Red)(NIR−Red) Where:
- NIR represents the near-infrared light reflected by the vegetation.
- Red represents the red light absorbed by the vegetation.
Healthy plants absorb most of the visible light and reflect a significant portion of the near-infrared light. Unhealthy or sparse vegetation reflects less near-infrared and more visible light, resulting in lower NDVI values.
Applications of NDVI
- Agriculture: Farmers use NDVI to monitor crop health, identify stress areas, and optimize irrigation and fertilization practices.
- Forestry: NDVI helps in assessing forest health, monitoring changes over time, and detect disease or pest outbreaks.
- Environmental Monitoring: NDVI is used to track vegetation changes, monitor deforestation, and assess the impact of environmental factors on plant health.
Benefits of NDVI
- Early Detection: Identifies plant stress before it becomes visible, allowing for timely intervention.
- Precision Farming: Enables targeted application of resources, improving efficiency and reducing costs.
- Long-term Monitoring: Facilitates tracking of vegetation changes over time, aiding in sustainable land management.
NDVI, with its simplicity and effectiveness, remains an essential tool in multispectral imaging for anyone involved in agriculture, forestry, and environmental management.